Word Shift Graphs
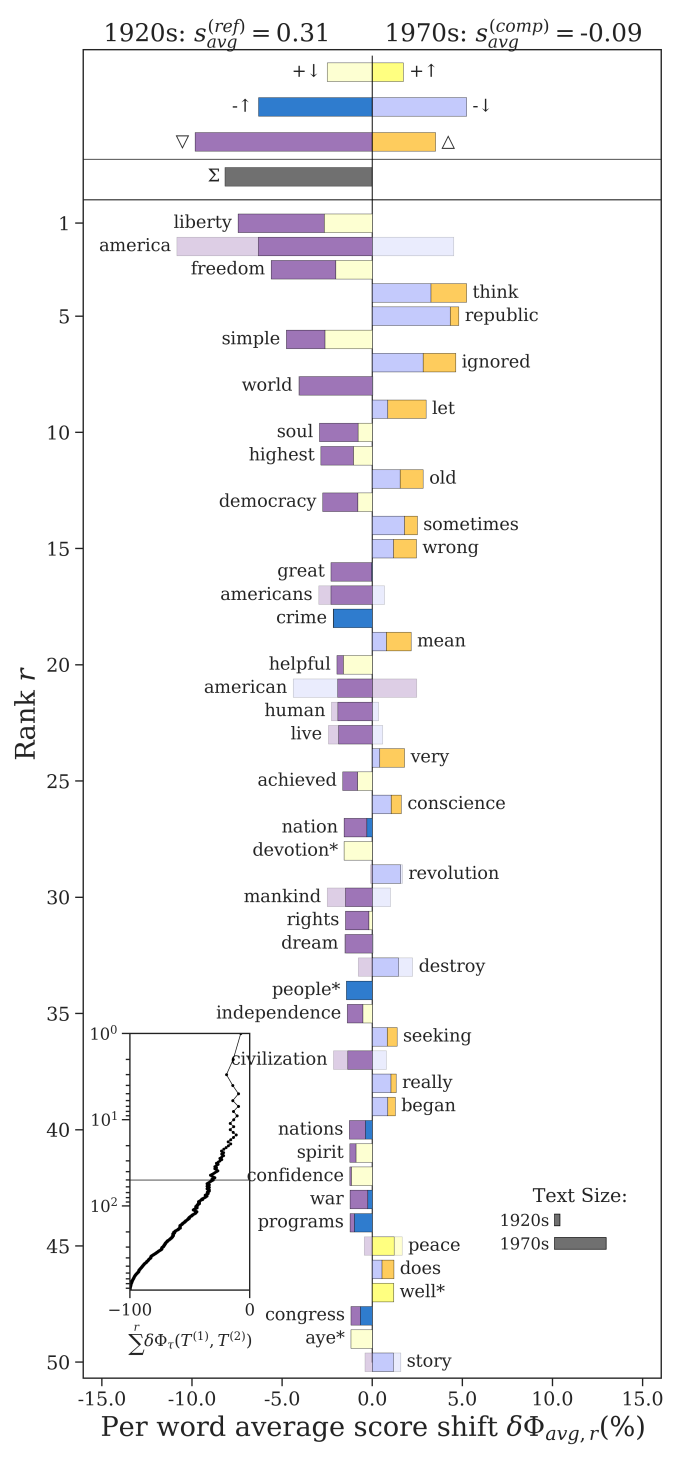
Word shift graphs are vertical bar charts which quantify which words contribute to a difference between two texts, and how they contribute. By allowing you to look at changes in how words are used, word shifts help you conduct more interpretable text analyses. Word shift graphs can be used for comparing texts according to word proportions, sentiment, or more complex entropy-based measures such as the Kullback-Leibler or Jensen-Shannon divergence. Generally, any word-score dictionary can be used with a word shift graph to disentangle the differences between two texts. If you are ever thinking of using a word cloud in a scientific analysis, use a word shift graph instead.
An open-source implementation of word shift graphs is available in Python through the shifterator package. A cookbook of how to use word shift graphs is available at the official documentation.
For more details on how to construct and interpret word shift graphs, see the following paper:
Gallagher, R. J., Frank, M. R., Mitchell, Lewis, Schwartz, A. J., Reagan, A. J., Danforth, C. M., Dodds, P. S. (2021). Generalized Word Shift Graphs: A Method for Visualizing and Explaining Pairwise Comparisons Between Texts. EPJ Data Science, 10(4).